Here are some notes on processing RNA-seq data to find differentially expressed genes.
A much abbreviated version of this pipeline comes from Cufflink’s Tutorial Page
The extended version given below follows the more exploratory pattern of someone who hasn’t done much (any) NGS data analysis before.
Tools Used
Requirements
Sequence Files
We are starting from Illumina generated Fastq sequence files. The reads contained in these files are paired-end and 40bp long. We are using mouse data. The naming convention follows the format: s_LANE_PAIRED_sequence.txt. So s_1_1_sequence.txt is the “left” side of the paired-end data on lane 1 and s_1_2_sequence.txt is the “right” side.
Pre-built Index
There are a number of pre-built indexes that TopHat makers provide . For the mouse genome, they have “m_musculus_ncbi37”, “mm8”, and “mm9” currently listed in their ftp directory.
We also have our own indexes, in our genomes directory. The index used in the initial run was labelled Mus_musculus.NCBIM37.52.
Gene Model Annotations
We also want to supply TopHat with a list of gene model annotations. This is in GTF v2.2 format, and the chromosome names must match those in the index. For the initial run *Mus_musculus.NCBIM37.52.gtf was used.
Pipeline Run
The pipeline looks to be pretty simple:
Sequences > TopHat> Manual Check > Cufflinks> Analysis
Removing Duplicates
No duplicate removal step was performed. Pros and Cons that this seqanswers post seems to address well. Bottom line is that it is impossible to tell if a duplicate read really is from pcr bias. Removing them causes a loss of information and location based removal methods don’t work with RNA-seq data.
TopHat
TopHat Configuration
There are some settings to get right for TopHat. Here are the flags and the initial values I used.
Average Mate-Pair Inner Distance
-r/--mate-inner-dist
This is a required setting for paired-end data with no default value. For this kind of setting, I would expect them to have a table or something that provides some suggestions on how to get this right.
Also, when speaking to associates, it sounds like their formula incorrect - or at least misleading. Here, I’ll try to explain it a bit more clearly as how we see it.
We are trying to provide TopHat the average distance between the ends of the paired-end reads. So, we have our library which is composed of fragmented cDNA (the DNA insert), ligated to adapter sequences on both sides. This library is size selected after the adapters are ligated to the DNA insert. So, a 300bp library would have 300bp - Adapter_Length size inserts.
The trick is that during sequencing, sequencing starts at the DNA insert - not at the beginning of the adaptor. You can see that this is the case from Illumina documentation. For example in the Cluster Generation step shown here - it ends with the sequencing primer being hybridized to the DNA-templates. So, in order to figure out the distance between pair-end sequences, we need to subtract the Adapter_Length from the library size. There are adapter sequences on both sides of the DNA insert, so we need to subtract from both sides as we are reading from both sides. The total length of the Left_Adapter + Right_Adapter should suffice - this is what I’m calling Adapter_Length.
Mate-pair Distance Diagram
p=. 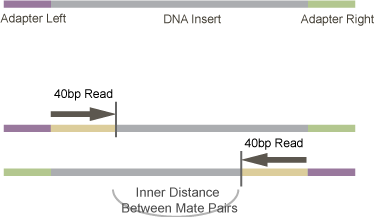
In total, to determine a good value for -r we need:
- The size-selection target for the final library (usually around 300bp)
- The read length (here 40bp)
- The adapter length (for TruSeq adapters this looks to be 120bp or 121bp. For other paired-end adaptors, it is 98bp.).
The formula then becomes:
Inner_Distance = Library_Size - (2 \* Read_Length) - Adapter_LengthOr, for our specific run:
315 - (2 \* 40) - 121 = 114315 was the reported average size of the library for this particular sample.
I didn’t fully understand all this on my initial run of the TopHat. So, my -r was set to 122 - which is close. I re-ran TopHat using the same parameters, but with an -r of 114, to see if there are any noticeable differences in the mapping quality.
Gene Model Annotations
-G/--GTF
Full path to the .gtf file for mouse that matches the index file you will be using (see above). In my case, Mus_musculus.NCBIM37.52.gtf. This is on a separate file system, but that does not seem to be a big deal.
Threads
-p/--num-threads
You would think that these software packages would settle on a single unified flag to indicate the number of processes to use - but you would be wrong. I’ve tried running with 4 and 8. Details on run times for these choices below.
Output
-o/--output-dir
As all the files generated by TopHat have the same name from run to run, it is best to use this option to put them into their own directory.
TopHat Run
The total TopHat execution string looks something like:
tophat -r 122 -G /full/gtf/path/Mus_musculus.NCBIM37.52.gtf \
-p 4 -o unique_output_dir/tophat/ \
/full/index/path/Mus_musculus.NCBIM37.52 s_1_1_sequence.txt s_1_2_sequence.txt
I would also ensure that your output directory exists prior to running. I do not know if TopHat creates this directory or exits out if it is not present.
With -p 4 this took around 13 hours to complete. With -p 8 it took ll hours.
TopHat Run Analysis
I wanted to have some level of confidence that the output produced by this run was good. The log files produced by TopHat are undocumented and less than helpful.
samtools flagstat
Online, I found some posts using samtools flagstat to look at sam/bam files.
I don’t understand why a tool that everyone seems to know about is not mentioned at all in the samtools manual page
Running samtools on the command line with no arguments provides a short help section. Here flagstat is listed with the description “simple stats”. Very helpful.
Here is the output for the first TopHat run that used 122bp for the -r parameter:
\$ samtools flagstat accepted_hits.bam

102925213 + 0 in total (QC-passed reads + QC-failed reads)
0 + 0 duplicates
102925213 + 0 mapped (100.00%:nan%)
102925213 + 0 paired in sequencing
51854282 + 0 read1
51070931 + 0 read2
65032742 + 0 properly paired (63.18%:nan%)
96061406 + 0 with itself and mate mapped
6863807 + 0 singletons (6.67%:nan%)
0 + 0 with mate mapped to a different chr
0 + 0 with mate mapped to a different chr (mapQ>=5)
Results from the second run with -r 114 were similar:
102918381 + 0 in total (QC-passed reads + QC-failed reads)
0 + 0 duplicates
102918381 + 0 mapped (100.00%:nan%)
102918381 + 0 paired in sequencing
51850866 + 0 read1
51067515 + 0 read2
63594438 + 0 properly paired (61.79%:nan%)
96054574 + 0 with itself and mate mapped
6863807 + 0 singletons (6.67%:nan%)
0 + 0 with mate mapped to a different chr
0 + 0 with mate mapped to a different chr (mapQ>=5)
Since -r 122 performed a bit better, I used it for the rest of the samples
I am not sure as to how useful this output really is. The 100% mapped sequences would indicate that it is not really looking at the whole picture.
From a flagstat biostar post - we see this information about the “properly paired” section:
“Properly paired” is from the flags set by whatever aligner you’ve used. For instance, if you use bwa’s ‘sampe’ alingment, you can specify the maximum insert length with -a. For a pair to be “properly paired” it would need to have both reads mapped to the same sequence within this distance.
So the properly paired section is (perhaps) an indication of how well our choice of the mean inner distance worked for this data (63% not being that great?).
To clarify, the flag that it looks to be counting is 0x2 in the sam/bam file. From the SAM format description this flag is described as “each fragment properly aligned according to the aligner”
samtools view -c -f 0x2 accepted_hits.bam

# 65032742

# same number as above in properly paired
According to an unanswered SEQAnswers question , TopHat might not be setting this flag correctly or perhaps this flag is used differently in TopHat. I haven’t found any answers from the TopHat developers, and I haven’t looked in the source code yet.
samtools view
The main question I would like to answer about this data is how many of the raw sequences were aligned and made it into the accepted_hits.bam file. Fastq files have 4 lines per sequence. So, to find the total number of sequences, one can use wc -l and divide by 4:
wc -l s_1_1_sequence.txt

# 188366840

# 188366840 / 4 = 47091710

# multiply by 2 to get

# 94183420 reads from both pairs
Then we need to know the number of unique alignments in the accepted_hits.bam file. It is possible for one sequence from the fastq file to align multiple times.
The accepted_hits.bam have collapsed together the two pairs, so the last component of the sequence names - the /1 and /2 are missing. (Look at head s_1_1_sequence.txt, then look at the first few values of field 1 of samtools view accepted_hits.bam and you will see the name difference). Hence, the total number will be 2 times the number of unique names found in the .bam file. Here is a piping of commands that should pull out the name of the read and then count unique names to determine how many unique read were aligned:
samtools view accepted_hits.bam | cut -f 1 | sort | uniq | wc -l

# 45153786

# 45153786 \* 2 = 90307572
So, from all this, we find that the total number of reads from the original sequence files that made it to the accepted_hits.bam file is:
90307572 / 94183420 = 0.958 = 96%fastqc
It is also possible to run fastqc on .bam files. I did that for the accepted_hits.bam file, but didn’t get too much from the resulting output.
Increased -r parameter
As a final experiment, I used -r 200 to see what difference it would make (as a decrease lowered the % properly paired). The flagstat results did show an increase in the number of properly paired sequences:
103022448 + 0 in total (QC-passed reads + QC-failed reads)
0 + 0 duplicates
103022448 + 0 mapped (100.00%:nan%)
103022448 + 0 paired in sequencing
51902899 + 0 read1
51119549 + 0 read2
72500578 + 0 properly paired (70.37%:nan%)
96158642 + 0 with itself and mate mapped
6863806 + 0 singletons (6.66%:nan%)
0 + 0 with mate mapped to a different chr
0 + 0 with mate mapped to a different chr (mapQ>=5)
However, I get the same number of unique mappings from the samtools view:
samtools view accepted_hits.bam | cut -f 1 | sort | uniq | wc -l

# 45153786
So we will stick with -r 122
Cufflinks
Initially at least, I am only looking for differentially expressed genes, and not attempting to discover novel genes and transcripts, so I didn’t think I would need Cufflinks. However, it does provide raw FPKM values - which I found useful when trying to compare the expression values of the sample replicates.
I ended up running Cufflinks after I did the analysis with Cuffdiff to go back and show that the replicates were similar. The parameters I used for Cufflinks were pretty much the same as the ones used for cuffdiff.
Cuffdiff
From the cufflinks manual
Cufflinks includes a program, “Cuffdiff”, that you can use to find significant changes in transcript expression, splicing, and promoter use.
Cuffdiff Configuration
Cuffdiff requires just a few inputs
GTF file
<transcripts.gtf>
This is the same gene annotation file that is provided as input with the -G flag to TopHat.
Output directory
-o
Same as TopHat, quarantine all the output to a uniquely named directory.
Number of Threads
-p
Same as TopHat, number of processes to use.
Labels
-L/--labels
Comma separated input to name each sample with.
Sample Bam files
<sample1.sam>
Bam files produced by TopHat runs
Cuffdiff Run
For this experiment, we have two wild type sample replicates and two mutant sample replicates. Thus, we call Cuffdiff like:
cuffdiff -p 4 -o unique_output_dir/tophat/ -L wt,mut \
/full/gtf/path/Mus_musculus.NCBIM37.52.gtf wt_1.bam,wt_2.bam mut_1.bam,mut_2.bam
And that was it. It produces a set of files - including gene_exp.diff which was the main output that I used for analyzing gene expression differences.
Analysis
Some quick notes on the limited analysis I performed on this data. Most analysis was done using R:
Replicate Analysis
First I wanted to show that the data was good. This included comparing the gene expression profiles of the two replicates for each sample. I normalized the FPKM data by taking the log2 of these values. I also removed values that were marked as having problems from TopHat (one of the columns in the gene_exp.diff has an “OK” if things were ok, and other values if things went wrong. I used only “OK” entries - which proved important when trying to compare replicates), and genes that were not expressed in both replicates.
I produced a lattice of scatterplots that showed correlation between each sample. I also produced a correlation matrix and the resulting correlation values that showed the replicates to be highly correlated.
Differential Expression Analysis
First I plotted the log2 values and highlighted those that cuffdiff thought were statistically significant (Up-regulated in red. Down-regulated in blue). Cuffdiff listed over 8,000 genes as noteworthy, so most of the rest of the analysis here was spent cutting that down to smaller chunks.
I used the log2 values and took only those genes with a 2-fold or more change. And then cut this down further by specifying to only look in the region we were interested in.
The End
Hopefully this can help others just getting started with RNA-seq data analysis. We hope to evolve this process and get good at finding biologically interesting/relevant changes for the researchers we support.