
Well, as you probably have seen, heard, and experienced, our beloved D3 has shed its skin, and metamorphosed into a shiny new version. D3v4 is out and ready for engaging with by interactive data visualizationers world wide. Its full of fun new features and optimizations for us all to appreciate and enjoy.
But as you would expect from a major version increment, there are some breaking changes as you move from v3 to v4. Most of these, like the renaming of scales and using .merge because selections are now immutable are fairly straightforward to find and modify in existing code.
The force layout, however, has received a significant facelift, which may cause it to not be all that recognizable anymore, even to close friends. I believe John Burn-Murdoch puts it well, when he says:
Transitioning to #d3js version 4 was going so well, and then ... force layouts pic.twitter.com/EAWcRpsspX
— John Burn-Murdoch (@jburnmurdoch) October 27, 2016
As many of my previous tutorials and talks use the force layout to some effect, I wanted to share what I’ve learned from converting some of them to use the new v4 API and stymie just a bit the inevitable bit rot and decay that accompanies the never-ending march of technology.
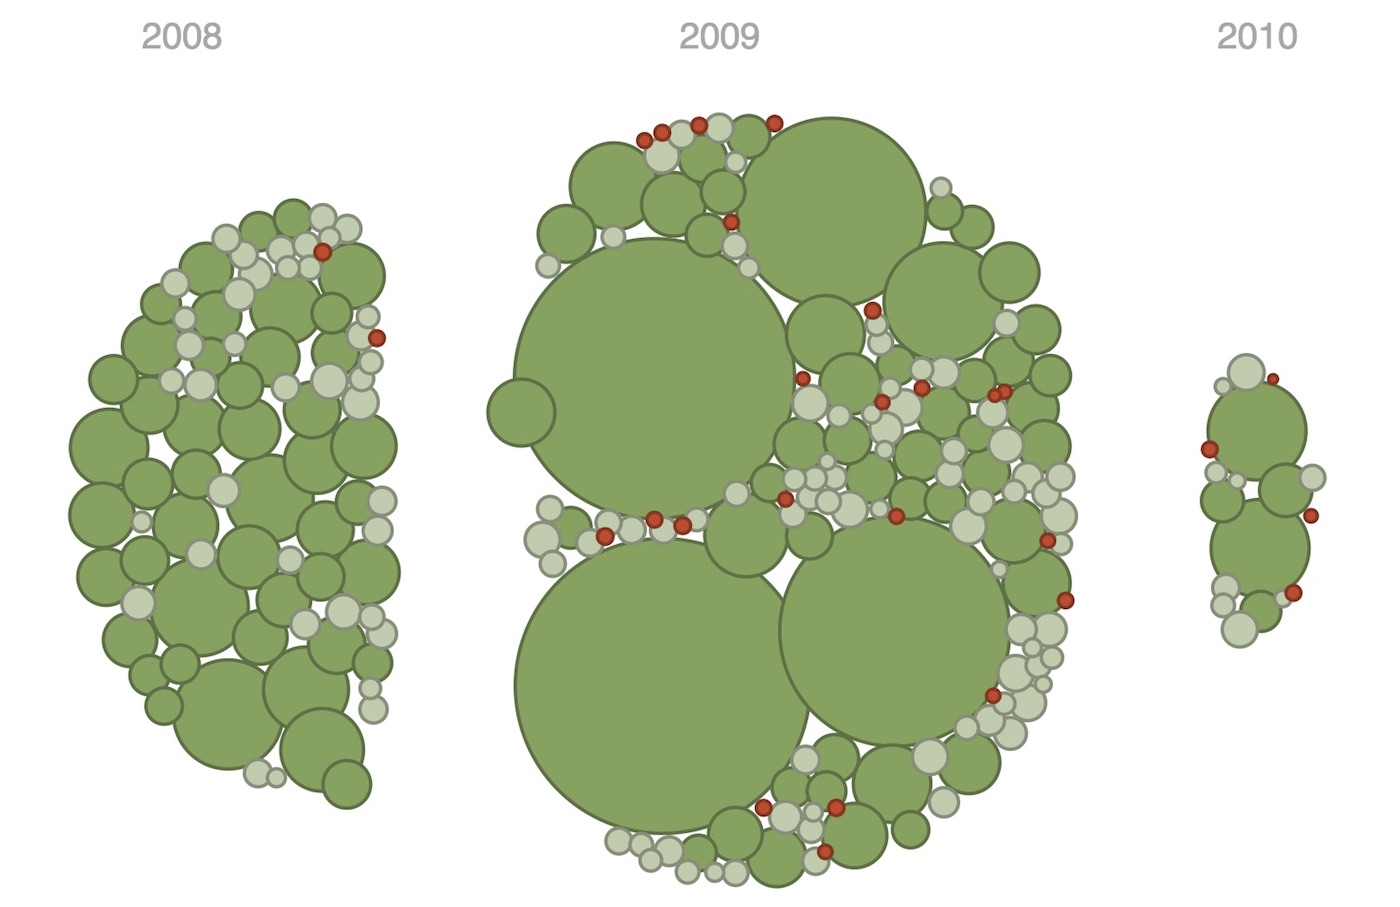
To that end, I’ve reimplemented my old bubble chart tutorial and example to use D3v4. I’d like to share what I’ve learned along the way and how you can use the new force simulation in your own projects.
Check out the demo and source code to see the new cool version, then come back here to see how its done.
The bubble chart makes use of the force simulation capabilities of D3 so its useful to get an overview of what the new force API looks like. Then we will dive into the code to make this fun, splittable bubble chart.
Force Fundamentals
Fundamentally, the general idea of the force hasn’t changed. It works as a little physics simulation, ran multiple times until it runs out of energy and stabilizes. Each iteration or “tick” of the simulation, forces are “applied” to nodes and edges - meaning they push and pull on them in various manners.
These forces (and other parameters of the simulation) determine where the nodes should be each tick, then it is up to us to visually represent the nodes and edges as we see fit and move them to their specified positions.
With this general framework in mind, let’s look at how this is implemented in D3v4 and how it differs from the previous versions of D3.
Starting up a Simulation
In the old world of D3 version 3, the force layout was an amalgamation of parameters and functions that configured a good baseline of effects applied to the nodes and edges of your graph.
The new D3v4 force more cleanly separates the setup of the force simulation from the forces applied to entities in the simulation. Instead of the old all-in-one approach, this abstraction provides an easy way to compose multiple simple forces together in a simulation to make something magical.
Let’s take a look at this new API in comparison with the old one.
Previously, as mentioned, we would create a new force layout with a bunch of parameters, like so:
// old v3 layout creation
var force = d3.layout.force()
  .size([width, height])
  .gravity(-0.01)
  .friction(0.9);
With v4, we create a new instance of the forceSimulation to house our nodes and edges as well as the forces applied to them. Most of the configuration of the old API is gone. Instead, as we will see, we configure the individual forces, instead of the simulation as a whole.
// new v4 force simulation creation
var simulation = forceSimulation()
  .velocityDecay(0.2);
We don’t even specify a size anymore! There are still some things you can configure at the simulation level. Here we adjust the velocityDecay which as stated in the documentation, works like friction, adjusting the velocity of the nodes by multiplying by 1 - velocityDecay each tick.
This points to some changes in what attributes are stored in each node, which we will look more closely at in a bit.
The simulation also controls the alpha or “energy” of the simulation (this alpha has nothing to do with opacity - as it is sometimes indicates when talking about colors). As the simulation progresses, the alpha decreases, and the simulation loses power and slows down. Eventually, when alpha reaches a threshold, the simulation stops. The rate of decay of the simulation can be adjusted via the alphaDecay function.
Note that in v4, the simulation starts automatically, without having a .start() method. If you want it to hold off, say until you have added some nodes to the simulation, then you want to follow the creation of the simulation with:
simulation.stop();
To keep that from happening.
Noodling on the Nodes
Ok, I’ve said “nodes” about a hundred times already, but what are they?
Nodes are the input data to your simulation. You can pass in an array of nodes when you initially call forceSimulation, or you can add them more explicitly via the nodes method:
var myNodes = [{name:'a'}, {name:'b'}, {name:'c'}];
simulation.nodes(myNodes);
As you can see from the above example, each node should be an object. This object can contain attributes about the data you are representing, but it also is where the force simulation puts node positioning information.
With D3v4, each node object you provide will get the following attributes added to it:
x- the current x position of the node.y- the current y position of the node.vx- the node’s velocity in the x direction.vy- the node’s velocity in the y direction.index- the index of the node in thenodesarray.
The main differences between old and new force with respect to nodes, are those velocity bits.
In D3v3, there was no vx or vy. Instead, the simulation kept track of the previous position that the node was in using dx and dy. This doesn’t matter too much for our Bubble Chart implementation, but affects things like how collision prevention works.
Forces Galore
Finally we get to the coolest part of the D3v4 force simulation - and also the most different and confusing part (at least to me): forces!
That collision prevention I just mentioned above? Thats powered by a force! In fact most of the details of positioning nodes in the force simulation is now left in the capable hands of one or more forces that get added to the simulation.
Each force is a function that gets called during each tick of the simulation. Its job is the modify the position of some or all nodes in the simulation, using those node attributes discussed above.
And while creating our own force functions should be fairly easy, thanks to Mike Bostock’s hard work, we get a great force starter pack built right in to D3! Check out the forces API docs to find forces made for x and y positioning, centering, and preventing collisions.
This distinction between the simulation and the forces applied to the simulation allows each force to care only about configuring itself. This also allows the users of these forces (us) to combine them in interesting ways to solve the unique problems of our force layout needs.
Adding a force to the simulation is straightforward. Here is an example of adding the centering force which keeps nodes centered on a particular point:
simulation.force('center', d3.forceCenter(width / 2, height / 2));
Adding a force using the force method takes a name for the force and then the instance of the force itself. We can configure the force as it is constructed. For the centering force, this means telling it where you want the nodes centered.
Each force has its own quirks and configurations, so go check out the documentation for the details.
Bigger, Stronger, Faster, Bubble Charts
Now that we have seen all the great new stuff about forces in D3v4, let’s finish off with how to implement a bubble chart with it.
As pointed out a few times now, the code is on Github and here is a demo.
Most of the code is fairly generic D3 - so let’s focus on the interesting force simulation bits.
We initialize the simulation with a few forces in place:
// constants used in the simulation
var center = {x: width / 2, y: height / 2};
var forceStrength = 0.03;

var simulation = d3.forceSimulation()
  .velocityDecay(0.2)
  .force('x', d3.forceX().strength(forceStrength).x(center.x))
  .force('y', d3.forceY().strength(forceStrength).y(center.y))
  .force('charge', d3.forceManyBody().strength(charge))
  .on('tick', ticked);
Here we create a new simulation and add some forces to it. The forces named x and y use positioning forces to push our nodes (which haven’t been added yet) towards the center of the visualization. We use these positioning forces instead of the forceCenter because, as the documentation states:
This force helps keeps nodes in the center of the viewport, and unlike the positioning force, it does not distort their relative positions.
But I want to distort their relative positions. I want them to all crowd around and jostle for the center.
Then we add a forceManyBody force to make the nodes repulse away from each other. In D3v3, we had access to the charge method, which assigned a positive or negative charge for each node. The many body force provides a similar capability, but is a heck of a lot faster then before.
And as you would expect, the strength of this force is a function that gets called for every node so we can adjust the charge based on some data attribute of our nodes.
Here is what the charge function looks like that is passed in as the force’s strength:
function charge(d) {
  return -forceStrength * Math.pow(d.radius, 2.0);
}
We based the charge on each node’s radius. The same forceStrength as what is used in the positioning forces is used here, so that all the forces work with the same amount of strength (which took some experimentation to make look “right”). The value returned by charge is negative, so the nodes repulse one another.
The end result of this many body force is that each node will avoid overlapping other nodes. We could have also used the Collision force, to prevent overlap, but with the many body force, the effect is more “organic” looking.
Check out Michael Currie’s awesome version of the bubble chart to see how to use collision instead of many body.
Finally we provide a tick callback method that will draw the nodes after each iteration of the simulation.
The ticked function for this is super simple, as it just moves the SVG circles used to make the bubbles to their new positions:
function ticked() {
  bubbles
    .attr('cx', function (d) { return d.x; })
    .attr('cy', function (d) { return d.y; });
}
Awesome. So now we have our bubbles all coalescing together in a big bubble pile.
Note that we aren’t using any transitions here. The “animation” is taken care of by the rapid repeated execution of the ticked function.
But how do we get them to split apart and into their categorical groupings? Well, that might be the one interesting trick this post can reveal.
It turns out if we add a force to a force simulation using force() and use the name of an existing force, it will first remove that existing force and then initialize our new force. You can see this in the force function’s implementation.
This means we can clobber our x force with a new one, then restart the simulation, and it will start using the new force with no issues. Great stuff!
For our bubble chart, we can use the following new forceX that will replace the “move to the center” force with a “move to your year” force.
Here’s what it looks like:
// This function is called once for each
//  node and provides the appropriate
//  x position for that node
function nodeYearPos(d) {
  return yearCenters[d.year].x;
}

// Reset the x force of the simulation
simulation.force('x', d3.forceX().strength(forceStrength).x(nodeYearPos));
And that’s it! Because of the beautiful composability of forces, the many body and y forces will work together with this new x force to create the node groupings.
There is one additional detail in that we need to restart the simulation to get the nodes to move to their new locations. We also need to “recharge” the simulation so the nodes have enough energy to get to their new locations.
We can do that simply by resetting the alpha of the simulation to 1 and restarting:
simulation.alpha(1).restart();
This is pretty much it! There are a few additional tweaks to the rest of the code, for scale renaming and such, but rest of the logic is the same. In the source code for the bubble chart I’ve used @v4 in the comments for sections that were modified in the switch to D3v4.
Hopefully this helps kick start your experimentation with the new force simulation awesomeness. Now go out there, build something cool, and let me know what you make!