Using Tilemill and OpenStreetMaps for Printable Map-Art
Awhile ago, Gregor Aisch, creator of the awesome up-and-coming Kartograph posted his Berlin Streets Visualized , a map of just Berlin streets inspired by Ben Fry’s All Streets Map .
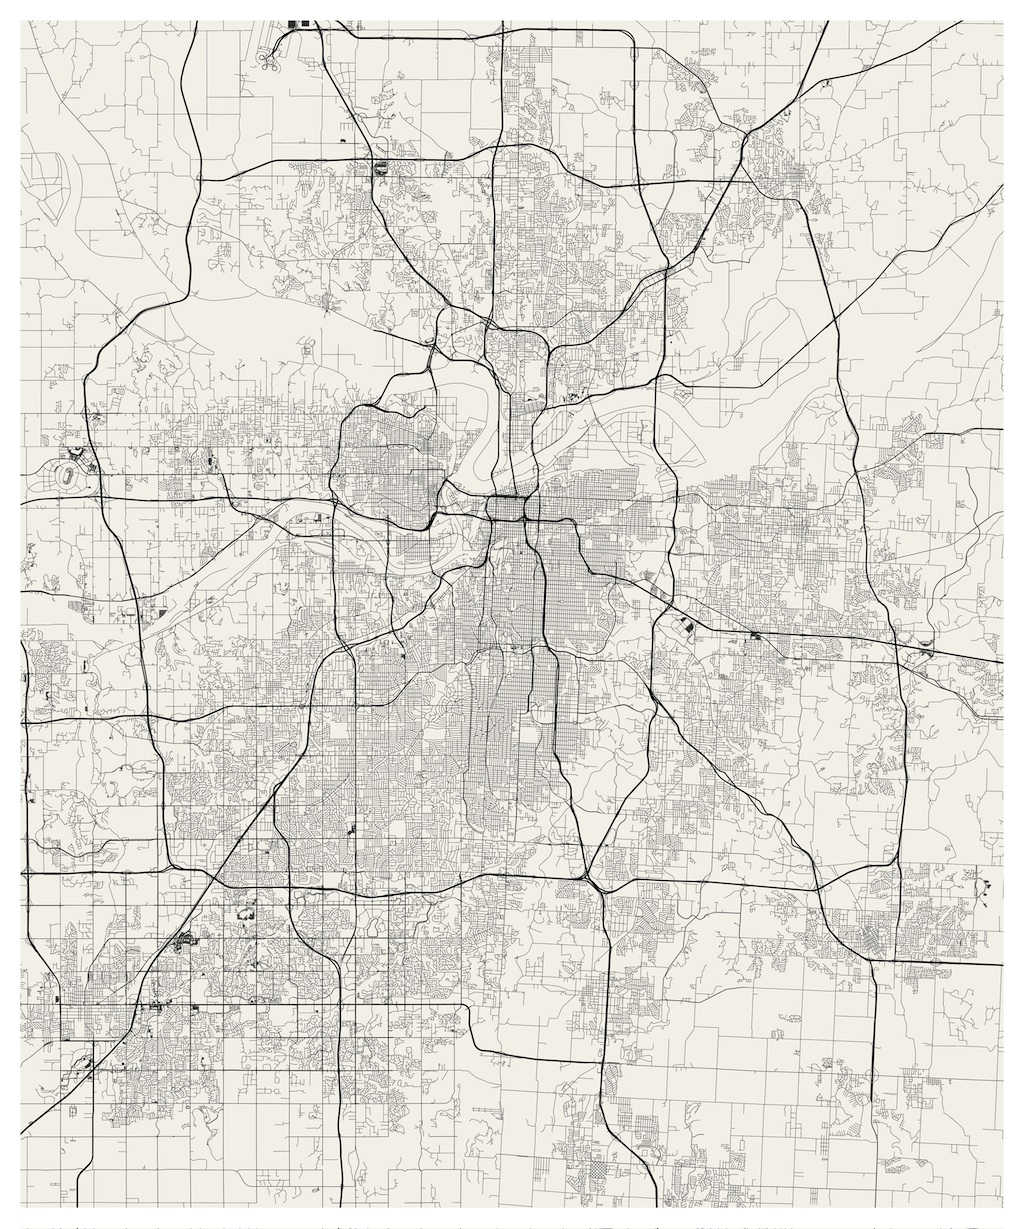
When I saw how nice and simple it was to create, I wanted to make one for myself, of my hometown - Kansas City. Here’s a scaled down version of the end result:
Gregor used street data in Adobe Illustrator form from the wonderful Cloudmade OSM downloads . Alas, Cloudemade’s downloads don’t include city level exports for North American cities (at least I didn’t see it anywhere).
So I decided to try a slight variation on the theme: use Shapefiles from OSM and style them using TileMill . Here I’ll spell out some of the specifics on how this works.
Metro Extracts
While it would be possible to use Osmosis to extract my local cities OSM data, fortunately for me, this was not necessary.
The wonderful Metro Extracts provided as a service by Michal Migurski (who’s blog you should subscribe to right now) gives you nice OSM extracts for a large list of metro areas world-wide.
The one gotcha with this service is that, unlike Cloudemade’s downloads, these extracts have not been converted to Illustrator format. I’m sure that getting it in that format wouldn’t be too hard, but honestly I’m pretty aweful at Illustrator, so wanted to try out a different way to style this data.
To this end, I grabbed the imposm shapefiles to work with in TileMill.
TileMill
TileMill is a great tool from the MapBox team. Its really meant create and style map tiles to be hosted on a service like their map publishing platform . They have some great looking map styles and you can upload your own custom tiles or data, like the NYPL Lab’s 1940s Census Tiles used on their Direct Me NYC site.
In addition to all this map tile stying, since version 0.6 TileMill has had the ability to export to SVG. This means we can style our map with TileMill, and get it in a vector format suitable for printing!
Here’s the basic process I used to import, style and export my street data:
Extract the shapefile archive.
Now you have a folder with lots of shapefile files inside.
Open TileMill, create a new Project called “KC Print Map”
I included the ‘Default data’, but then hid it in my final map styling.
Open your new Project
You should see a nice view of the world.
Select the Layers tab and load your shapefile
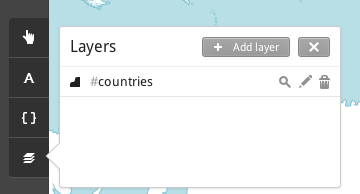
With the layers tab open, select Add layer. Navigate to where you extracted your shapefiles. Select the kansas-city-lawrence-topeka.osm-roads.shp file for your Datasource and use roads for your ID.
Note: Some of the road types have their own shapefiles, so you could import these layers separately and style them separately. This is the approach I started with, but ran into issues with missing road types and layering. So lets import all the roads, style the types separately (as we will see below).
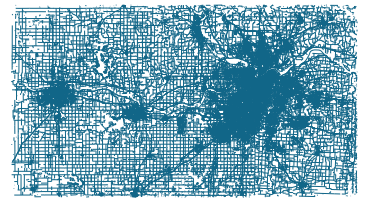
Select “Style & Save” and then zoom in to your road data.
You should have a nice view of all the roads in KC (or whatever metro you choose).
Now lets style these roads!
Carto
Carto is the styling syntax used by TileMill. It looks a lot like CSS, but is based on less so has support for variables and conditional effects, which we will make use of here.
Road Styles
The full style.mss file used to style the map can be found in this gist
Here, I’ll provide a shortened version of the code, to talk about:
Lets go over the details.
First we create two variables, @minor_color and @major_color, to store the two colors used to style the different road types.
The first style, for #roads sets the basis of what all the roads will look like. It makes all the roads skinny and sets them to the minor road color.
The stylings after that override this default setting for certain types of roads. We use conditional styles, (the [key='value'] component) to select which road type we are talking about.
First we hide a number of types that aren’t roads. The above example hides railways. I used QGIS to find all the different types of roads in the shapefile, but there are probably lots of ways to do that.
Then, for major roads and highways, we increase the line width and use the darker @major_color. These major road stylings use the New symbolizer syntax (the ::newsymbol) which creates a ordering of overlays. A poor-mans version of separate layers. This works because we start with small roads and overlay larger ones. So the order of the stylings matter. Something to keep in mind.
The nice thing about this approach is that we can try out all sorts of different stylings really easily. Want to make major roads green and highways really fat? No problem. A two line change and you have:
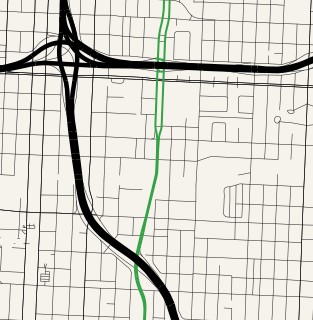
TileMill makes it really easy to explore different combinations of styles.
Export
Once you have something you like, its time to get it into a format suitable for printing.
Select Export at the top-right of the screen. Then select SVG. You might need to zoom into your region of interest again and crop using shift-drag as necessary. When you have the cropping how you want it, select Export.
This will generate a file in your TileMill’s export directory. I believe, by default, it is in ~/Documents/MapBox/export.
Finishing Touches
Ok, so I would be misleading if I didn’t mention that I finished up by importing the SVG into Illustrator to add a white border and to resize it to be 20x24in. Theoretically, you could do this part in any editor capable of handling SVGs. However, none of the actual styling of the map was done in Illustrator.
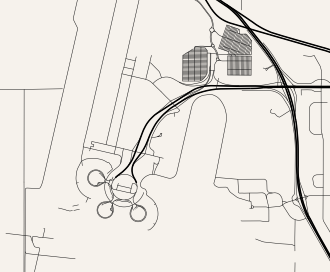
I enjoy how interesting landmarks jump out at you, even when presented with just the streets of a city you are familiar with. For example, here is our lowly airport:
So go out and create some interesting map art with TileMill and Open Street Map data!
And thanks to Gregor for the nice tutorial to copy!