Scrolling In Data Visualization
Examples
Here are a set of videos and links of examples of Scrollytelling in Data Visualizations.
These were collected for my OpenVis Conf Talk on Scrollytelling. Check this link for video, slides, code, and more!
Scrollable Dimension
These are examples of using scroll to show a dimension of the data. They aren't necessarily difficult to implement technically, but provide a way to take advantage of the dynamic nature of the web.
One Mile Scroll
Source: Daniel Eatock
Scroll through an actual mile. Allows for collaborative additions of new heights of things.
One Pixel Moon
Source: Josh Worth
A visualization of the entire solar system, translating physical space to pixels using the measure that the moon is one pixel.
Orbiting Satellites
Source: quartz
Scrolling down, we leave Earth and head towards the atmosphere to understand better just how many satellites are orbiting us from various positions in space.
Scroll as a Trigger
For these, the scroll just starts an animation or visualization. Here, the act of scrolling to a part of the page indicates the viewers readiness to ingest a new piece of content.
Hottest Year on Record
Source: Bloomberg
An initial scroll indicates that the user is ready to experience this visualization, and starts an animation that layers on average temperatures over the years, culminating in this years record breaking statistics.
World Cup Balls
Source: NY Times
The history of the soccer balls used in the World's Cup. Scrolling initiates image loading as well as the start of smooth, infographic style animations to show ball construction, and their changes over the years.
Scroll as Steps
Scrolling can move the viewer through different steps or segments of a visualization. These examples replace the stepper with scrolling.
Color Meaning
Source: Muyueh
Visualizing the relationships between colors and language, this interesting visualization steps us through how Chinese and English languages shape their respective speakers' interpretations of what colors are.
Clubs that Connect
Source: NY Times
An elaborate exploration of the highly interconnected network of World Cup players and the clubs they are associated with. Each step provides more detail on subsets of the data. The final piece allows the user to explore to find the clubs and players they are most interested in.
US Addicted to SUVs
Source: Bloomberg
Scrolling slices and dices a bubble chart every-which-way to show American auto sales trends and the continued rise of the ever expansive SUV.
Battle of the Berrics
Source: George Murphy
The Recession in 255 Charts
Source: NY Times
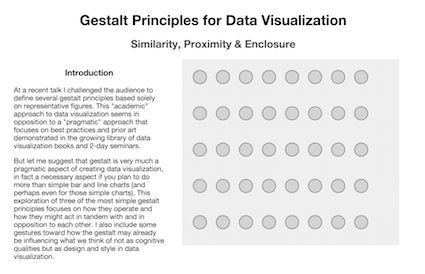
Gestalt Principles
Source: Elijah Meeks
Continuous Scrolling
Next, instead of atomic increments in the story, the scroll can be incorporated into a continuous transition of the data that is being displayed.
Russia Left Behind
Source: NY Times
NY Marathon Videos
Source: NY Times
The Water We Eat
Source: Angel Amorelli
Lets Free Congress
Source: Tony Chu
Jeter Swings
Source: NY Times
Scrollytelling
Finally, when continuous scrolling is combined with the presentation of many different media types, we reach scrollytelling. Most famous is probably still Snow Fall. Typically combines text with video and images, but there is no reason why interactive components could not be presented in the mix too.
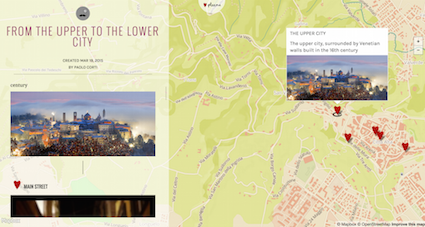
Shark & Minnow
Source: NY Times
Shark And Minnow uses text, images, and video based maps to talk about the difficulties uncertainty faced by the Philippines, and other nearby countries due to China's rising power and desire to assert its dominance.