Technologies change with the times. Nothing stays the same. Awhile back, I experimented with TileMill to create a “streets only” view of Kansas City - with hopefully enough detail in the instructions that you could do it yourself for your own hometown.
Recently, Mapbox has released Mapbox Studio - which looks to be the successor to TileMill for all your map design needs. A revolutionary feature is the use of vector tiles to power the maps, instead of traditional image based solutions. Mapbox has been kind enough to include lots of data sources built right into Mapbox Studio .
This means, to make street maps, we might not need to import any additional data. Wow!
I wanted to try my hand at revamping the simple streets only Kansas City map using these new technologies. Join me, won’t you, on this adventure!
Start Me Up
After registering for a Mapbox account and downloading Mapbox Studio, we are introduced to Mapbox Studio by a nice little default map.
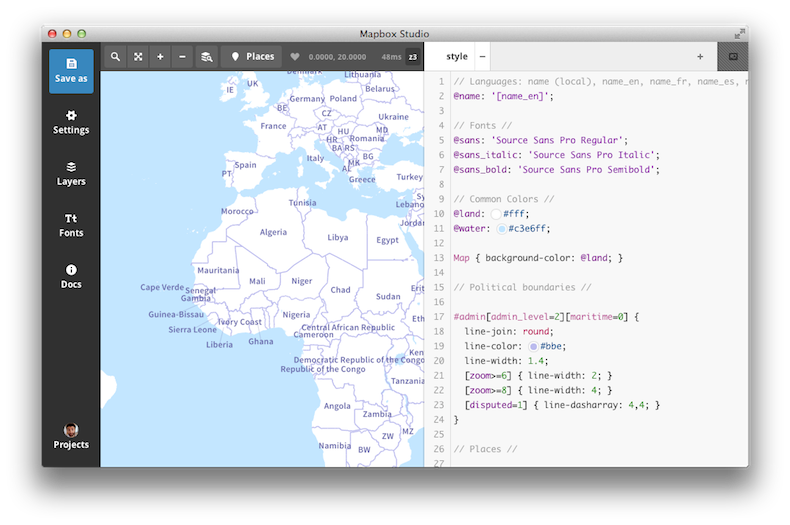
While we could probably start styling right now, I’d like to explore the project creation part of Mapbox Studio. Clicking on the “Projects” button in the lower-left portion of the window, opens the project menu.
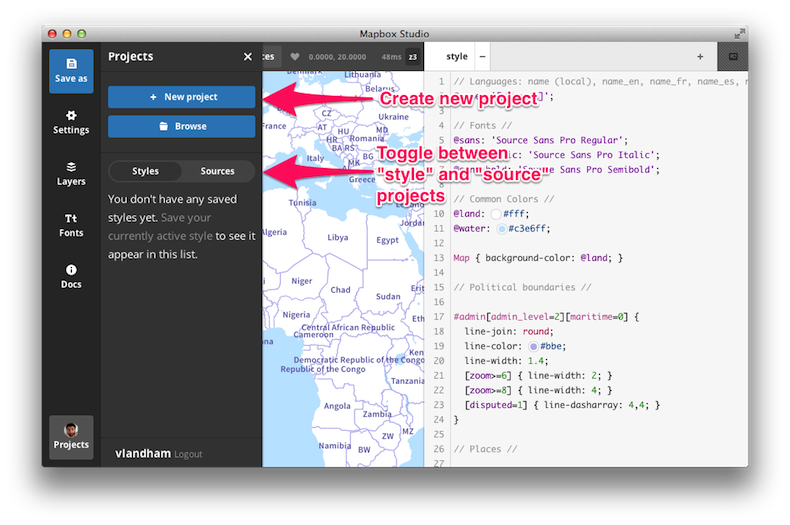
It took me a second to figure out that there were two types of projects - style projects that deal with the look and feel of the map, and source projects that are used to define data sources. Guess I should have read a bit more of the documentation !
So, I want a new style project, which is toggled by default.
Clicking on “New Project” provides a plethora of built-in styles to start from.
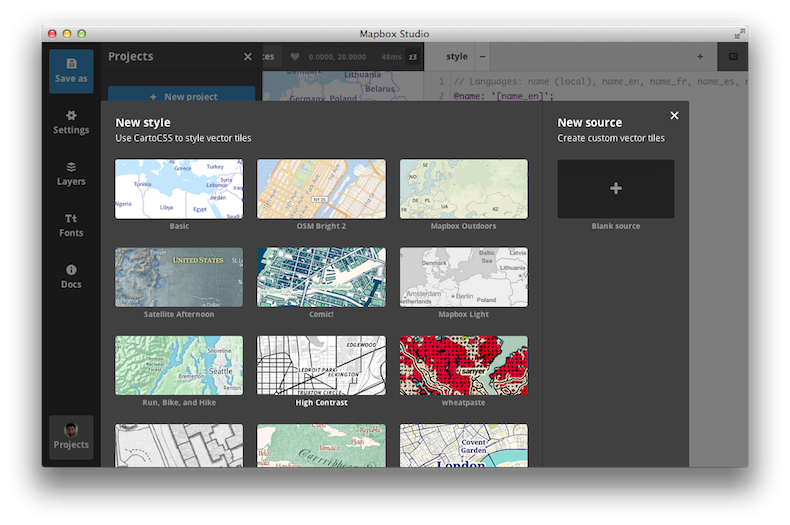
We could start with a blank slate, but I was intrigued by the “High Contrast” style - which looked a bit like a supped up version of the streets map. Selecting this style, we are transported back to the map panel, but we a new view and a new starting location.
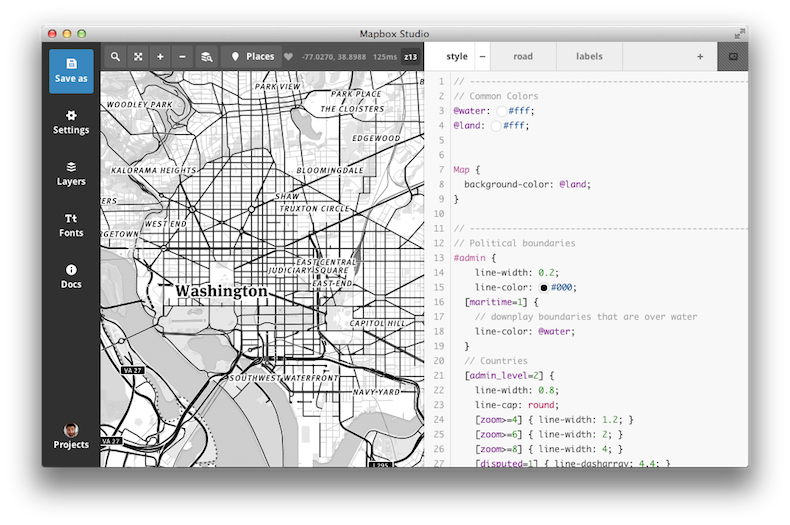
Style Me Up
Already, its looking pretty awesome!
On the left, we can see the CartoCSS that is used to make the map look the way it does. There are multiple style files, each one focusing on styling different portions of the map. The files provided with this style are style for general map features, road for styling roads at different zoom levels, and labels for (you guessed it) labels.
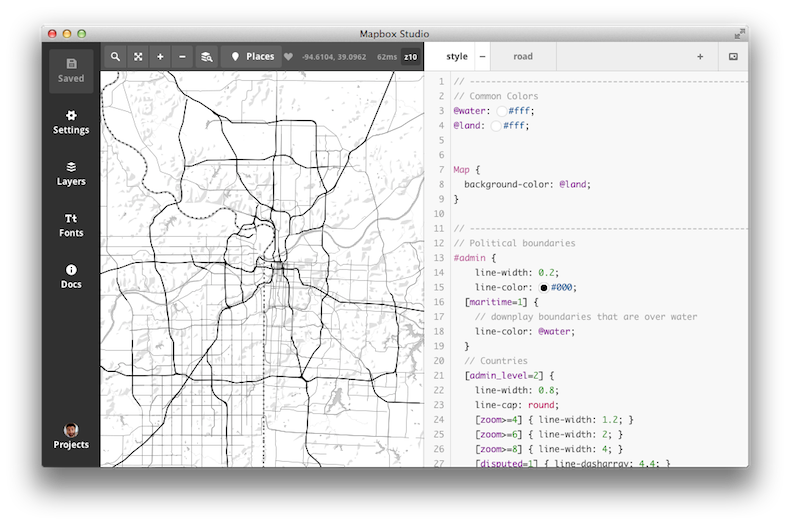
Real quick, let’s switch to our region of choice - Kansas City, using the nifty built in search feature.
No panning and dragging necessary!
Ok, now lets start styling.
First, we can ditch the labels style file, as we don’t want any labels at all. Click on the labels tab and then the little minus sign next to it. After confirming to remove, the style file is gone - but the labels remain. What?
Turns out we have to save to get the update to show up (as was the case with TileMill).
Clicking on the “Save As” button allows you to find a place to save the style project. After saving, we can now see the labels are gone.
Now we want to style some roads. The plan is to copy most of the style from my previous streets style . This means I’ll end up deleting most of the built in roads styles too - but I wanted to keep it around to get a feel for how to work with this new data source.
Looking at the styles in roads, we can see that #road entries have a class associated with their OpenStreetMap tags . Here is a sample:
To confirm that these classes are in the data, we can switch to the data explore view to see the metadata behind all these little lines on our map.
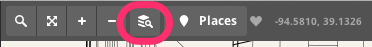
On the top bar, click the little “layers with magnifying glass” to switch views. Now you can view an x-ray of the data on the map. Click around a bit to see some of what is available.
Pretty darn impressive, if you ask me.
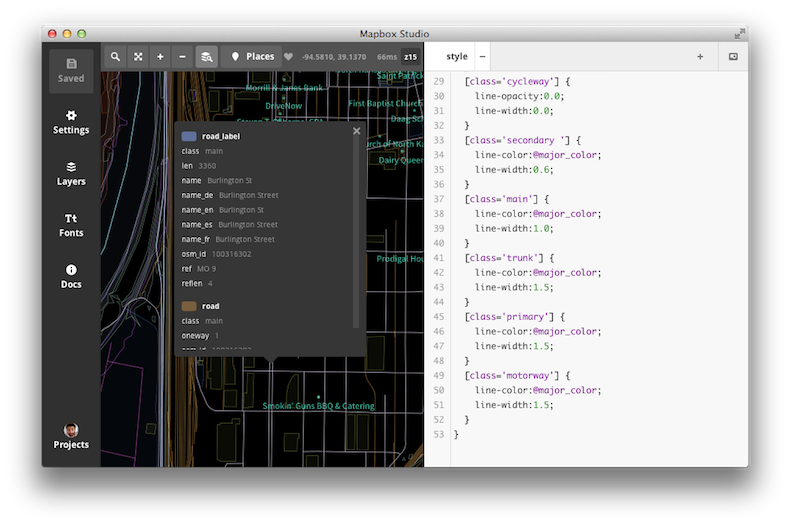
We can see that indeed each road has a property called class which seem to match the OSM names. So, I need to modify my original stylings to use these classes.
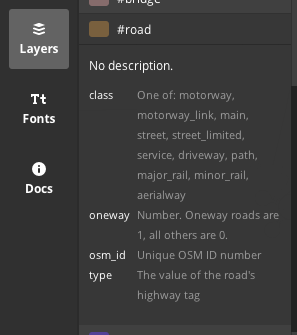
(Also, the class names are listed in the description section of the roads layer data)
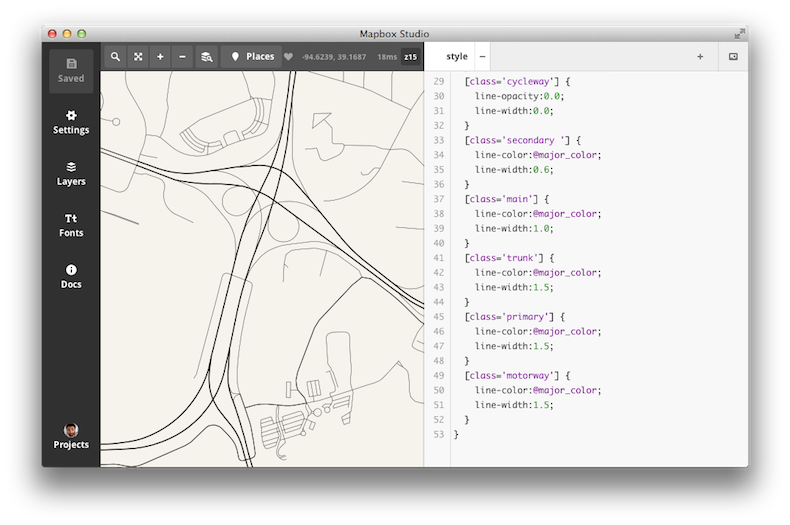
I deleted the roads stylesheet now (even though it was really cool and useful to learn from), and augmented my old CartoCSS a bit. Here is the styling I came up with.
I’m sure I’m missing out on a ton of cool CartoCSS features, but I just wanted to get something out quick.
It looks like you have to zoom in to see all the road types (not sure how to override these default zoom levels for all roads).
Extract Me Out
So now we have a basic road map, we want to get it out of Mapbox Studio to print.
Unfortunately, unlike TileMill, Studio doesn’t (yet?) have the ability to export to SVG or another vector format (which seems a bit odd since the input data is vector now…).
However, you can export high resolution pngs, so let’s try that out.
Currently, there are two great tutorials from Mapbox about printing from Mapbox Studio:
Both might be more useful then my own ramblings, so refer to them if I’m not doing it for you.
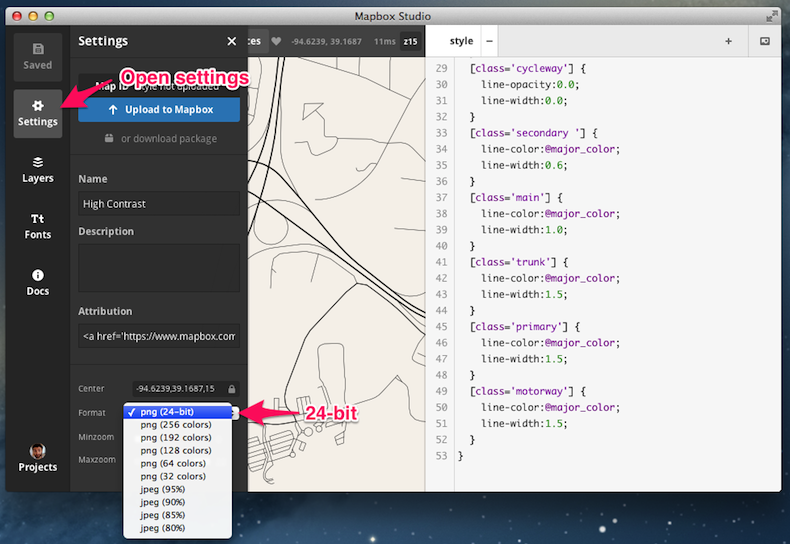
First, we should go into settings and switch to 24-bit png to maintain top quality.
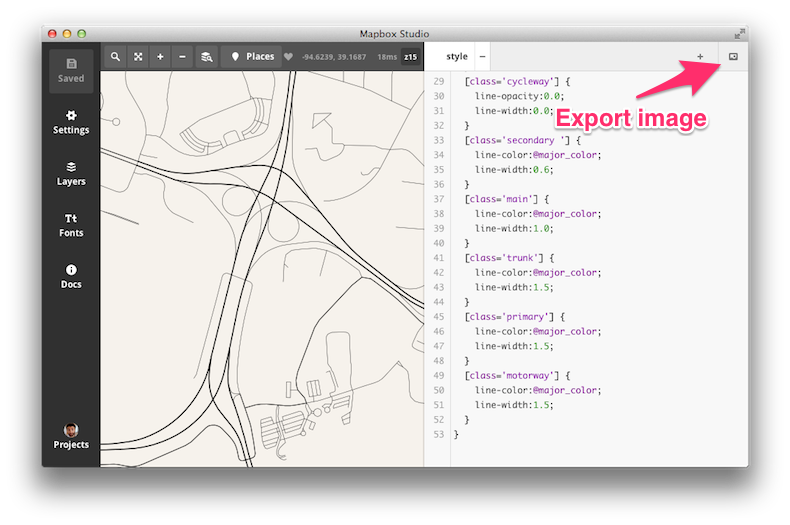
Next, we open the “Export Image” tool, which is located in the upper-right hand corner of the window.
Exporting still sounds a little tricky.
First, you draw a bounding box around the portion of the map you would like to export.
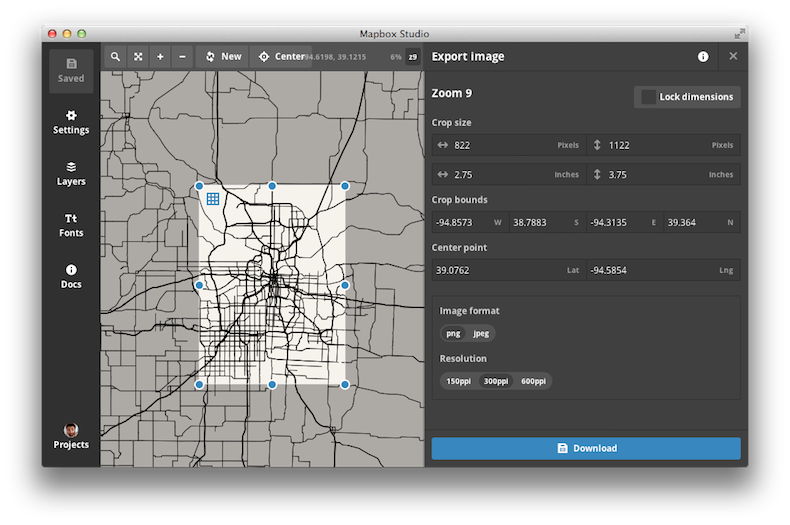
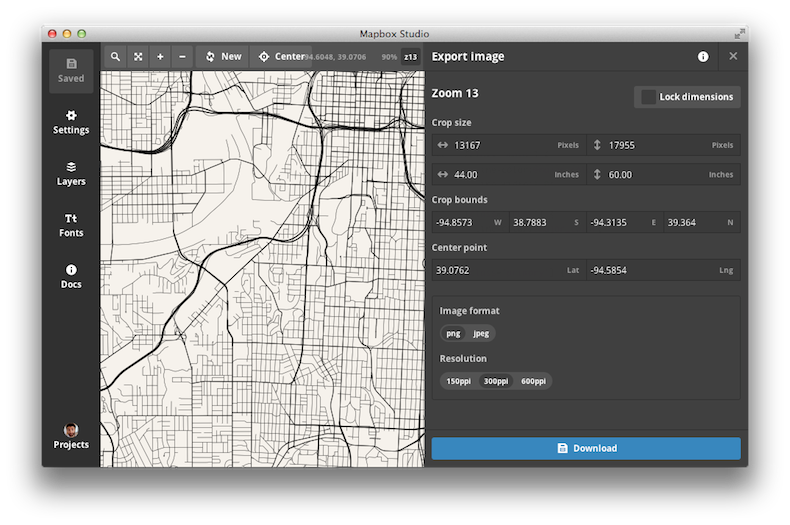
Then, you need to zoom in until you are at the desired zoom (which determines the size of the image) you want to create. In this test, I’ve zoomed to level 13.
Make sure the output format is as you like. You want png as the image format, and I’m exporting to 300ppi.
Then hit Download!
According to the web to canvas , if your bounding box is too big then you will need to export slices of the map and join them back together in the end.
I expect some of that might be automated in the future.
For 300ppi, at 13 zoom, I could download the entire KC export in one piece.
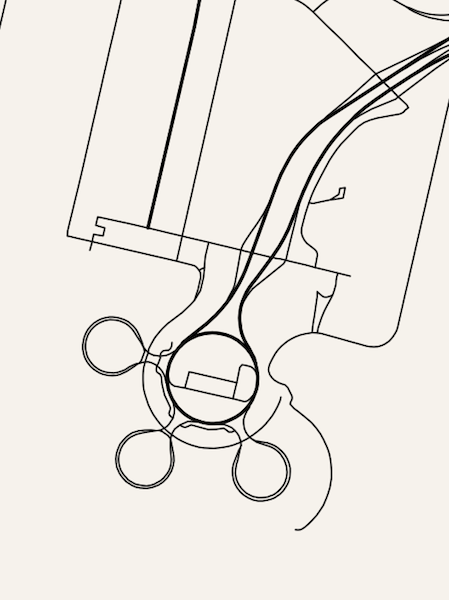
Put Me Up
The end result is a 40MB png file of Kansas City - ready for printing.
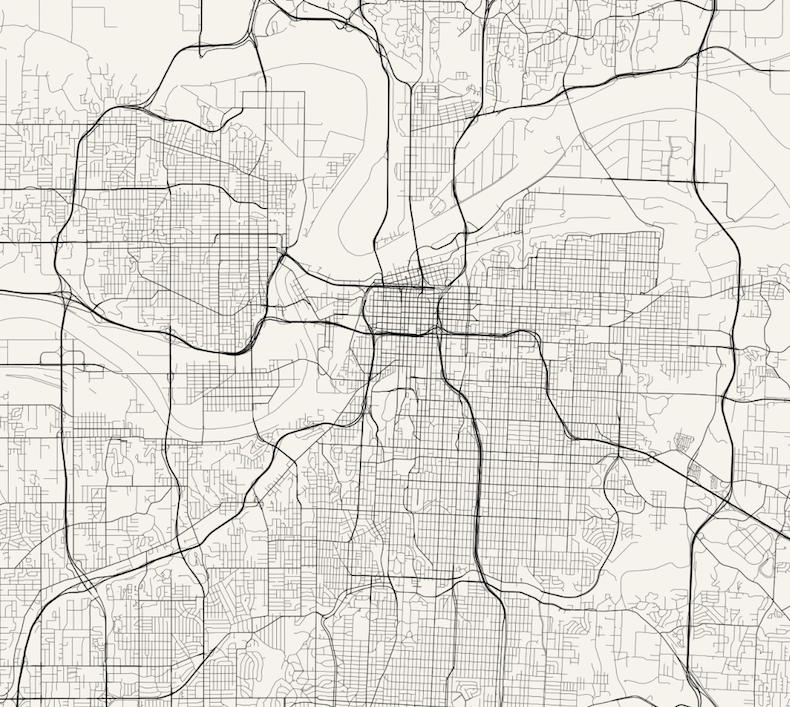
Still fun to explore and find the little hints of the city that you remember.