Update: This code has been updated to use D3v4. Please Enjoy!
A critical component of successful interactive visualizations is orienting the users to what they are looking at. In a multi-faceted data story, it can be useful to explicitly move a user through the different views of the data.
Previously, we’ve looked at steppers as a way to implement this guidance system.
Here, I’d like to look at how the simple act of scrolling can be harnessed to direct a user through a complex visualization combined intuitively with a guiding narration.
Data Scrolling
There have been many interesting uses of scrolling in data visualization and interactive storytelling (which I will talk a lot more about in my upcoming presentation). In fact, Mike Bostock recently published a wonderful set of best practices on How To Scroll to maximize the use of this tool.
For this tutorial we will look at some of the implementation details for scrolling in data visualizations. I’ll focus on a common pattern that moves the user through discrete sections of content, while modifying the visualizations accompanying the text to create a unified data driven story.
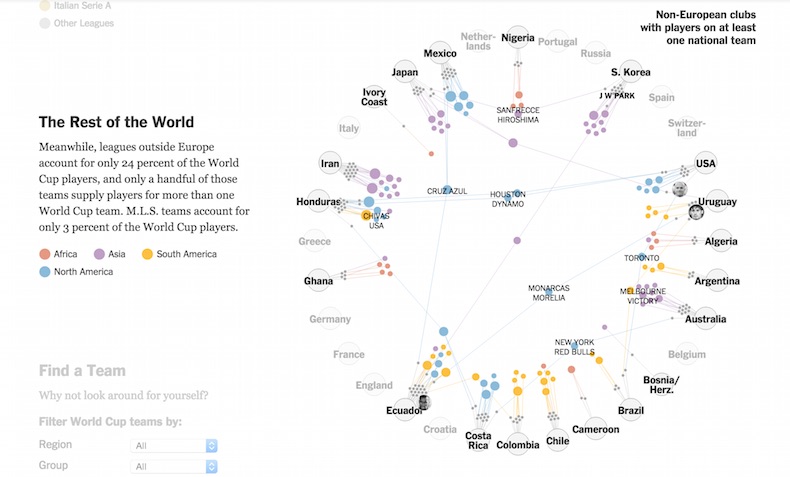
This technique has been used in many places including the New York Times with Gregor Aisch’s The Clubs That Connect The World Cup:
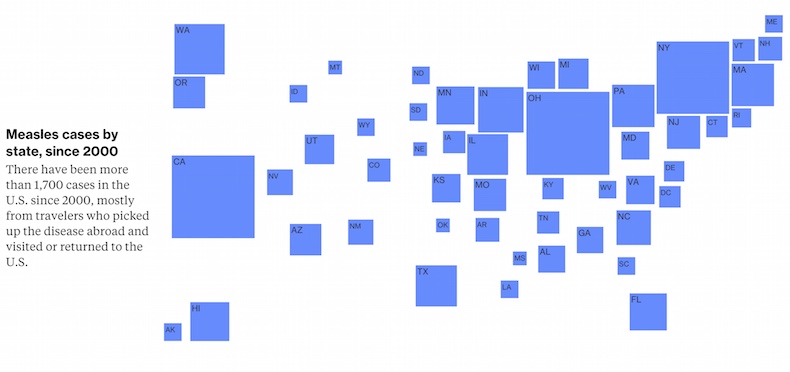
And at Bloomberg with Adam Pearce’s American Truck Addiction and Measles Outbreak visualizations.
You can find a lot more examples in my talk and associated resources page.
I’ve created a demo that attempts to explain a lot of how to make these types of interactives, but covering a much less serious topic then these actual news reporters. As this tutorial will contribute to my upcoming OpenVis Conf talk in April, I decided to take a look at all the mistakes I made in my 2013 talk.
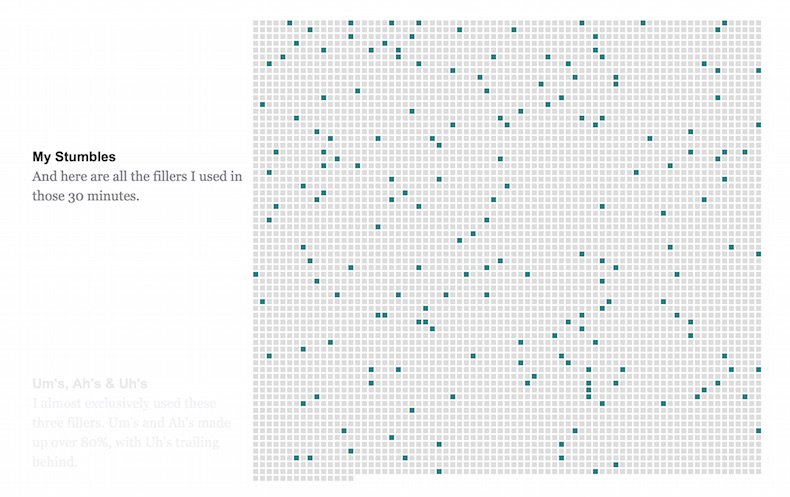
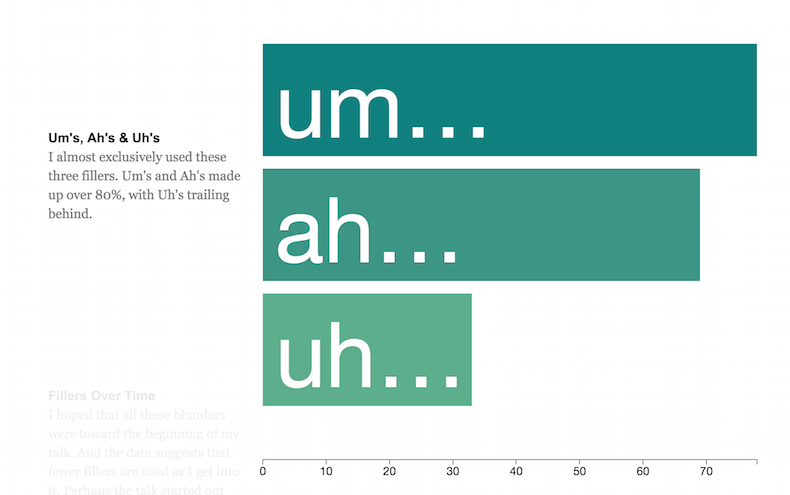
Specifically, it is a story around the frequency of filler words - “ah”, “um”, and “uh” - said during the talk. Take a look, and then, lets get started with looking behind the curtain at how to build this.
As usual, the code is available on github.
HTML and CSS Structure
Like all great web-based masterpieces, we must start with the basic, but critical task of getting our HTML framework for this visualization in place.
Let’s create a #sections div that will be used to hold the text portion of our interactive. Each section of text will live in a separate section element. The visualization component go in #vis which is put after .sections:
<div id='graphic'>
  <div id='sections'>
    <section class="step">
      <div class="title">OpenVis Conf 2013</div>
        I did what no presenter should ever do: I watched my own talk...
    </section>
    <section class="step">
      <!-- another section -->
    </section>
  </div>
  <div id='vis'>
  </div>
</div>
Now the CSS needs to get the scrolling text next to the visual display. Here is the gist of it:
#sections {
position: relative;
display: inline-block;
width: 250px;
top: 0px;
z-index: 90;
}

.step {
margin-bottom: 200px;
}

#vis {
display: inline-block;
position: fixed;
top: 60px;
z-index: 1;
margin-left: 0;

height: 600px;
width: 600px;
background-color: #ddd;
}
The inline-block display type allows us to position the #sections and #vis elements side-by-side while still providing a width and height. We also make the #vis position fixed, which makes it stay in the same place, even as we scroll. The margin on the .step elements ensures we have some space to scroll in for each section.
I’ve added a height, width, and background to the #vis - just so we can see where it will be. Even without any JavaScript, we can start to see the structure. Pretty cool!

A Reusable Scroller
Now, let’s turn to the details of figuring out where the page will be scrolled to. With a bit of work, we can encapsulate most of this code into a stand-alone function that can be reused in other projects. Most of this is based on the Bloomberg Visual’s excellent work - so thanks again to Adam Pearce for all his help!
The code for this scroll detection capability is in scroller.js.
The basic idea of what the code does is fairly straightforward:
Given a set of sections, figure out where these elements are located vertically down the page. When the page is scrolled, figure out which of these elements is currently front-and-center in the browser’s viewport. If this element is different than the last ‘active’ element, then switch to this new section and tell the visualization.
Easy right? Well, plenty of details to get right.
First, our main function takes a D3 selection that indicates the scrollable elements. In the demo, we call it by passing in d3.selectAll('.step'), but it is generic enough to accept any selection.
We want to get the vertical coordinates of where these sections start on the page so that we can find the nearest one as we scroll. There are probably a dozen ways to do this, but here is one:
sectionPositions = [];
var startPos;
sections.each(function(d,i) {
var top = this.getBoundingClientRect().top;

if(i === 0) {
startPos = top;
}
sectionPositions.push(top - startPos);
});
Here sections is again, the text steps that our users will scroll through. We use getBoundingClientRect to get the position of each element. The trick is that this position is relative to the viewport. If the user has scrolled partway down the page and then reloads, the top value for all the sections they have already passed will be negative.
To accommodate this, we make all section positions relative to the first section. So the section at index 0 has a section position of 0 and all other sections follow from that.
sectionPositions will be accessible to the code that figures out which section the user has scrolled to, which we will look at next.
Detecting the Active Section
The next step of our little scrolling algorithm is to detect which section the user is scrolled to. This position function will be called initially on load, and then whenever the window is scrolled by binding to the scroll event like this:
d3.select(window)
.on("scroll.scroller", position);
The .scroller suffix is how event namespaces are created in D3, so we don’t accidentally clobber event binding in other parts of our code.
Here is the position function. We will walk through it in detail below:
function position() {
var pos = window.pageYOffset - 10;
var sectionIndex = d3.bisect(sectionPositions, pos);
sectionIndex = Math.min(sections.size() - 1, sectionIndex);

if (currentIndex !== sectionIndex) {
dispatch.active(sectionIndex);
currentIndex = sectionIndex;
}
}
The first step is to find pos - the users current position on the page. Here, we use pageYOffset which is an alias to scrollY. This gives the vertical position on the page that the browser is currently scrolled to. We offset it just a bit with the - 10.
Next, we turn to the power of d3.bisect to pull out the index of the current section that has been scrolled to. I discussed d3.bisect in my linked small multiples tutorial, but it merits another look.
Given a sorted array of data and a new data element, d3.bisect will find the right spot for inserting that new element in the array to maintain its sorted-ness. It bisects the current array in the right spot to insert the new element. Its does this by performing a binary search on the array to find the insertion position.
The default bisect provides the index to the right of the insertion point. Using it here, we are asking for the index of the section after the section that was just scrolled passed.
It took me awhile to wrap my head around this, so perhaps an example will help. Here is an array of sorted values:
var nums = [0,100,200,300];d3.bisect returns the index to the right of a match:
d3.bisect(nums,0);
=> 1
And also:
d3.bisect(nums,99);
=> 1

d3.bisect(nums,100);
=> 2
This is why we subtract 10 from the current position, so we start at index 0:
d3.bisect(nums,-10);
=> 0
The index can be one past the length of the sectionPositions array, so we make sure to keep it within bounds using:
sectionIndex = Math.min(sections.size() - 1, sectionIndex);This index serves as the key to the visualization component of our site to know what it should be displaying. If the currently scrolled to section index doesn’t match the currentIndex, indicate the new index using d3.event.
Event Dispatching and Binding
Events are a great way to keep your code de-coupled and free of explicit dependencies, so let’s deviate a bit from the code flow to talk about them a bit more.
Like a lot of frameworks, D3 has its event generation and dispatching capabilities. Though, this works a bit differently than other eventing libraries I’ve used.
First, you need to create a dispatcher, using d3.dispatch. On creation, you indicate the event types the dispatcher will be able to dispatch. For our scroller, our dispatcher code looks like this:
var dispatch = d3.dispatch("active", "progress");This means we can dispatch the active event and the progress event, which we will get to in a bit.
Now these event types are methods on our dispatch object. So, as we saw in the position function, we can send a new active event like so:
dispatch.active(sectionIndex);The sectionIndex is passed as an input parameter to the handler of this event type.
In our visualization code, we will handle this event by adding a listener to the dispatcher’s event using dispatch.on. The code to listen to active events will look something like this:
scroll.on('active', function(index){
// ...
}
One hiccup is that .on is a method of the dispatcher, but our dispatch object is internal to our scroller code. We don’t really want to expose this internal detail to users of scroller. A cool trick to solve this issue is to use d3.rebind to copy our dispatch .on method to our scroller instance:
d3.rebind(scroll, dispatch, "on");Check out the details in the example but this gives the scroll object the power of .on, which acts like a pass through - sending it on to the dispatcher to handle things.
Progressing Through a Section
So the code we have now will let us get notified when the user scrolls to a different section of text. This is great. It means we will be able to trigger visualization changes on these section changes.
But there are times when you might want to hook up animations within a section as the user scrolls. Tony Chu provides a great example of this kind of interaction with his Let’s Free Congress project. Scrolling within sections modifies the visuals in interesting and fun ways.
Inspired by this functionality, we can modify our code slightly to also allow for these kinds of within-section interactions.
Back in our position function, I’ve added this little snippet to the end of the function:
var prevIndex = Math.max(sectionIndex - 1, 0);
var prevTop = sectionPositions[prevIndex];
var progress = (pos - prevTop) / (sectionPositions[sectionIndex] - prevTop);
dispatch.progress(currentIndex, progress);
Here we just find the previous section’s top value, and compute how far into the current section we are. The number will range from 0.0 to 1.0, and we send that value along with the current index in the progress event.
With this little change, we can now get updates as to where the user has scrolled within a section.
Warning : there is some inconsistencies with how far different scrolling mechanisms move the page. If you want to get real specific, you might checkout a tool like jQuery Mouse Wheel that attempts to normalize this scrolling across devices.
Now, let’s finally use our scroll events to make some visualizations move!
Visual Transition Tips
With the scrolling events in place, most of the visualization work becomes standard D3 functionality. The code for this part of the demo should be well commented. Its long, but not all that exciting, from a cool-new-code perspective.
But there are still a few details worth talking through. Here are the steps, and perhaps a set of suggested best practices that I’ve compiled while examining example code and building up this visualization.
Setup All Visual Elements on Start
Sometimes I enjoy getting the enter, exit, and update functions of D3 working together in the same place. But with so many visual elements, I found it easier to just append all of them at one time during the initialization of the visualization.
setupVis is the function that performs this initialization. The elements for each section are added, and then hidden. Here is an example:
// square grid
var squares = g.selectAll(".square").data(wordData);
squares.enter()
.append("rect")
.attr("width", squareSize)
.attr("height", squareSize)
.attr("fill", "#fff")
.classed("square", true)
.classed("fill-square", function(d) { return d.filler; })
.attr("x", function(d) { return d.x;})
.attr("y", function(d) { return d.y;})
.attr("opacity", 0);
Here, I’m setting up all my .square’s with width, height, and position. Then hiding them by setting their opacity to 0.
If you visualization was even more complicated, you could have a separate function for setting up each sections elements to keep things more module.
Each Section Executes a Function
When the user scrolls to a new section, we want to show the new visuals for this section. Each of these visual changes is encapsulated in its own function
As we will be passed in the index of the current section, we can organize our section functions in an array:
activateFunctions[0] = showTitle;
activateFunctions[1] = showFillerTitle;
activateFunctions[2] = showGrid;
activateFunctions[3] = highlightGrid;
activateFunctions[4] = showBar;
activateFunctions[5] = showHistPart;
activateFunctions[6] = showHistAll;
activateFunctions[7] = showCough;
activateFunctions[8] = showHistAll;
Then bind to the active event to activate the right function
scroll.on('active', function(index){
plot.activate(index);
}
Here, the activate function will call the current section’s function using this activateFunctions array:
activateFunctions[index]();It does some other work as well, so we will look at it in more detail in a minute.
Our progress event is processed in a similar fashion.
Section Functions Show Their Section and Hide Their Neighbor Sections
Technically, each section function could comprehensively deal with every single element of the visualization. With a few sections, this might not be terrible, but the complexity would quickly spiral out of control with more sections added.
Fortunately, this is not necessary. If you think about it, a section function really only needs to worry about showing the elements used for that section, and hiding the elements that were used in the section before it. But since a user can scroll both ways, we need to ensure the section that comes after is dealt with as well.
A simple example from the code is the first title section function. As nothing comes before it, it only needs to be concerned with showing its text elements and hiding elements of the title that comes after it in the second section.
function showTitle() {
g.selectAll(".count-title")
.transition()
.duration(0)
.attr("opacity", 0);

g.selectAll(".openvis-title")
.transition()
.duration(600)
.attr("opacity", 1.0);
}
Track Last Section Seen to Deal with Fast Scrolling
Unfortunately, what I’ve just told you about these simplistic section functions was a lie. A lie I wanted to believe myself. It’s true that under normal scrolling conditions, dealing with neighboring sections is all that needs to be done. With speedy scrolling, there is a chance that our scrolling event won’t fire for sections that are passed through too quickly.
So there is a chance that these intermediate step functions won’t get executed, leaving your visualization in an invalid state.
We could deal with this issue in the scroller code, but that seems a bit too brittle and specific to this particular use case. Instead, we can perform a little extra work in the activate function to ensure that all functions that should be are executed in order.
Here is the full code for activate:
chart.activate = function(index) {
activeIndex = index;
var sign = (activeIndex - lastIndex) < 0 ? -1 : 1;
var scrolledSections = d3.range(lastIndex + sign, activeIndex + sign, sign);
scrolledSections.forEach(function(i) {
activateFunctions[i]();
});
lastIndex = activeIndex;
};
So, we track the last activeIndex we have seen. When activate is called, we create an array of indexes using d3.range. With normal scrolling behavior, this range will just go from the current activeIndex to the new one. But with faster scrolling, the array will contain all the in-between steps, so we can call them in the right sequence.
Make Everything a Transition
Inside these section functions we are moving around elements and modifying lots of their attributes. The important thing to remember is to make all these modifications d3.transitions, even if you want them to happen immediately. This way, if the user is scrolling from one section to another during a transition, the transition will be interrupted and the transition for the current section will come into effect.
Here are some examples to help clarify the issue. Each example shows a circle being animated back and forth across the screen using transitions.
First we have the general case. The left-to-right transition finishes, and then the right-to-left one begins. No problems here. Everything looks dandy.
What happens if a transition isn’t completed before the next transition starts? For example, the user scrolls to a different section before the current sections animations are complete. Here is what we want to have happen. The left-to-right transition takes too long, and the right-to-left transition starts before it has a chance to complete. As long as they are both transitions, it doesn’t matter. The first transition is interrupted and the second one starts, as expected.
But, if we had not been using transitions for both movements? Say, we had tried to set the circle’s position directly with something like:
vis.selectAll(".circle")
.attr("cx", x);
Well, that would be bad! Instead of interrupting the transition, the animation would just continue unexpectedly - putting your visualization into an invalid state, until another transition corrected things:
If you want an effect to be immediate, use a duration of 0 for that transition.
g.selectAll(".bar-text")
.transition()
.duration(0)
.attr("opacity", 0);
If you try to mix transitions with straight attribute modifications, you most likely will end up with visualizations in strange states.
Use Named Transitions for Transitions that Shouldn’t Be Interrupted
For a few of my transitions, like where the little filler squares leave their spot on the grid, they can be interrupted multiple times with fast scrolling and not quite make it back to their spot. The results are less than flattering.
This was happening because transitions focused on changing these square’s fill value were interrupting this movement transition. I could double check the square’s locations in multiple different section functions, but this would complicate these unrelated functions unnecessarily.
Instead, I used the new-ish D3 feature of named transitions to ensure other transitions wouldn’t clobber this one.
g.selectAll(".fill-square")
.transition("move-fills")
.duration(800)
.attr("x", function(d,i) {
return d.x;
})
.attr("y", function(d,i) {
return d.y;
});
The name allows it to run concurrently with other transitions, ensuring the squares will always make it back to their homes!
Here is an example of using named transitions to change the color and position of the circle. The two transitions don’t interrupt one another, as they have two different names.
I haven’t used this feature much, but I’m excited to try it in other complex transition scenarios.
Go Forth and Scroll
Hopefully with this post I’ve dispelled some of the dark art of scrolling for you, and for myself.
Scrolling should still be used carefully and with the end user always in mind. And as pros like the New York Times continue to show us, sometimes a stepper is exactly the right tool for the job.
But when scrolling is what you want, check out the details of this post and the demo code. And if you want to hear me blather even more about scrolling, then you’ll be excited about my upcoming OpenVis Conf talk on this very subject!
As always, the code for this demo is on github Have suggestions or comments or complaints? Let me know!
An aside: The title comes from the epic Sierra Adventures Game Quest for Glory I - which I try to bring up in almost every conversation. If you haven’t tried it yet, go download Boxer, grab a copy and enjoy. Scrolling can wait for a bit.