UPDATE - Feb 11, 2015 This is an old post, and needed some love. I’ve updated it a bit with the following changes:
- New github repo - for the D3 visualization part at the end
- Automatically determines the projection’s scale and translation (from a Bostock Example ) - so this should work easier for any geojson file generated.
- JavaScript as well as CoffeeScript implementations for the D3 part.
Hope this helps keep the content relevant. Let me know if you see improvements that could be made!
A method for editing, merging, simplifying, and converting Shapefiles to GeoJSON
FYI - You might also want to check out Mike Bostock’s Let’s Make a Map post which covers a lot of the same ground.
D3.js supports cartographic visualizations by being able to display lines, polygons, and other geometry objects . It uses GeoJSON as the storage format for this type of visualization.
Likewise, map tiling libraries like Leaflet can use GeoJSON to create map layers .
You can find some GeoJSON files around, like in D3’s choropleth example , but sooner or later you will want to visualize a more specific portion of the world.
Specifically, I am interested in visualizing census data for my hometown: Kansas City. Kansas City is perhaps a bit unusual, from a census point of view, as it is actually two cities in two different states: Kansas , and Missouri . Also, I’m not really interested in the rest of these states - just the Kansas City metro area. So what I really want to do is merge multiple Shapefiles, cut out the interesting section, and convert this to GeoJSON. Making it as small as possible (in terms of filesize) in the process.
Below is how I created a small GeoJSON file of just the KC metro from census shapefiles.
WARNING: I am not an expert in GIS or cartography in general. This may not be the best way to get a custom GeoJSON. In fact, cutting up shapefiles into custom GeoJSON files might not even be a good idea in the first place. However, if you want to look at small piece of the world in D3 or other GeoJSON capable tools, this might be a way to start.
Tools
I’m using a mix of different applications to perform this conversion:
- Quantum GIS is used to deal with shapefiles.
- NOTE: I ran into a few issues trying to get QGIS installed on my Mac - though a Mac version is available. So instead of fighting this, I just used the Windows version on an XP machine. This all should be possible using just the Mac version, but the screenshots will be of Windows.
- MapShaper a free online tool is used to simplify the Shapefile and reduce its filesize.
- GDAL is used to convert shapefiles to GeoJSON. I was able to install this easily on my Mac using homebrew:
brew install gdal
Initially I did run into an issue with homebrew when it was installing the geos prerequisite. Following the instructions on this github issue fixed this. GDAL would also work on a Linux box, and there looks to be a Windows port as well.
Getting the Data
Census.ire.org provides a way to download census 2010 data, including shapefiles of the tracts / counties the data is for. I downloaded Shapefiles for Kansas and Missouri at the Census Tract Summary Level. The files together are over 10MB in size, and transforming them into GeoJSON at this stage creates over 30MB of data - too much to render in the browser all at once. Certainly there are more sophisticated ways to deal with this issue, but for the time, I just want to explore some KC data quickly.
Merging Shapefiles
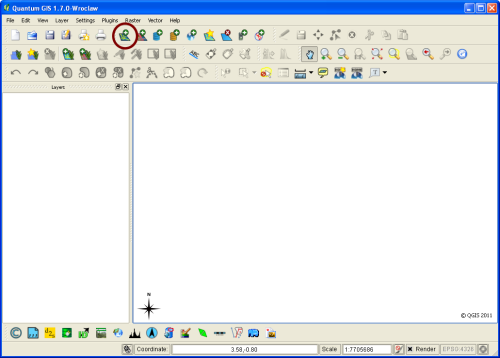
Open up Quantum GIS and select Add Vector Layer as shown below:
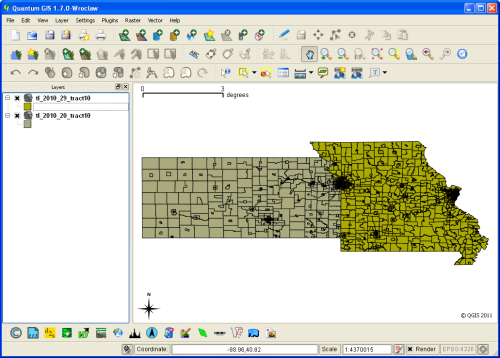
Click Browse under Source and select your Shapefile. Repeat if you have multiple shape files. Here’s Mine with both Kansas and Missouri open:
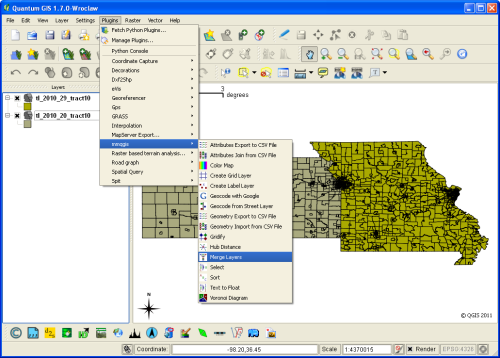
Merging these layers was tricky (for me). I ended up needing the MMQGIS plugin for merging. To install this, first select Plugins -> Fetch Python Plugins. In the Repositories tab, I selected Add 3rd party repositories. When it adds the plugin repositories, it seems to get stuck on one of them. Clicking Abort will let you continue without this repo. In the plugins tab, search for MMQGIS, select it, and then click Install plugin. Then you should be good to go.
With this plugin installed, you will have a new menu item under Plugins called mmqgis. Navigate here, then select Merge Layers:
Select the Shapefile layers you want to merge then select a location to save the merged Shapefile. After this, you should have an additional Shapefile with all the geometry from your multiple Shapefiles in one file.
Selecting a Portion of Shapefile
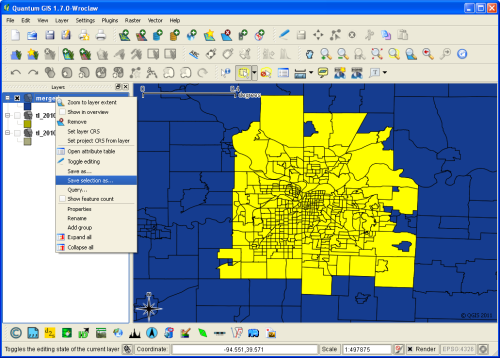
Ok, maybe your region doesn’t exist in multiple Shapefiles, but some times you don’t want to deal with an entire state’s worth of data with visualizing. Use the “Select features by rectangle” tool to highlight the portion of the merged Shapefile you are interested in. Holding down Ctrl allows you to add / remove individual sections as well. Once you are satisfied with your selection, right click on the merged Shapefile in the left-hand Layers table, and select Save selection as :
And presto! You should now have a Shapefile of the smaller selection saved on your system. You can open it back up with Quantum GIS, but for the rest of the tutorial, we will be done with this application.
Simplifying a Shapefile
To reduce size further, you might want to simplify your Shapefile. This looks to be possible in Quantum GIS, but I wanted to try out MapShaper which is recommended in the D3 documentation. Click launch, and upload the .shp file from the output of your Quantum GIS work.
I don’t have a good idea of how simplified you can go, but for Census Tract Shapefiles, I didn’t see much degradation even at 50% simplification level. When happy, click export in the upper right-hand corner and choose Shapefile - polygons. Download the two resulting files.
NOTE For the next step, we want to maintain the ‘properties’ section populated by data from the Shapefiles. Do ensure this section isn’t empty, replace your .shp and .shx files with these simplified versions, and don’t remove the rest of the files. This is to say delete your original .shp / .shx files and rename these simplified versions to match your old ones. Let me know if that doesn’t make sense.
Converting to GeoJSON using GDAL
Transfer these files to your Mac / Linux machine. You should have a folder with all the Shapefile files. Now we want to create a GeoJSON file for D3 to use from these files. Using the ogr2ogr command to do this is pretty straightforward. It would look something like:
ogr2ogr -f geoJSON kc.json kc.shp
Note that the output file name comes before the input file name.
You should now have a GeoJSON file of your custom Census Tract section, ready to be used in D3.
Here is my KC Metro GeoJSON file . You can see (if click on a tract) that the properties object maintains the information necessary to map the GeoJSON feature back to a Census Tract.
Display in D3
Update Feb 11, 2015 Now this code has its own github repo: d3 geojson example
As a test, I wanted to display my new GeoJSON file in D3. Make sure to include d3.geo.min.js in addition to d3.min.js for the path functions. Below is the minimum amount of code I used to display this GeoJSON file using D3 and coffeescript (and I now have a JavaScript version implemented in the repo ). This assumes that there is a div with the id of vis in your html .
This is mostly the same code as the D3’s choropleth example . This now figures out the translation and scale automatically, thanks to Mike once again.
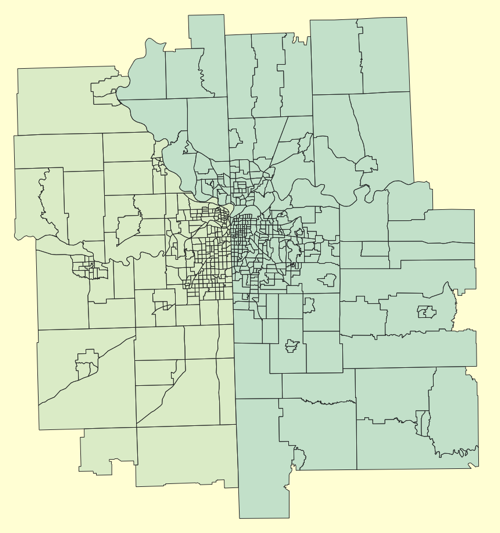
I also use the “STATEFP10” property of each tract to determine the fill color. This results in different colors for Kansas and Missouri, to show that these properties are present in the simplified GeoJSON. Here’s an image of the result:
This is certainly just a start to the possibilities of using D3 and geojson. As mentioned at the top, Mike Bostock also has an amazing map making tutorial that focuses on the benefits of topojson - so check that out!
